 Organic Workflow
 Peptide Workflow
 Scale-Up Flash Purification
  Sample Preparation
 Biomolecule Purification
 Oligo synthesis
 Scavengers and Reagents
 Service & Support
 Accessories & Spare parts
 Investors
 Reports & News
 The Share
 Corporate Governance
 Calendar
 Sustainability
 Our Offering
 Our History
 Our Locations
 Leadership
Before we get into our extractions, we need to set up our LC/MS to detect our analytes of interest. The LC will provide the chromatography - or separation of our analytes - and the MS will support detection. So, which one do we evaluate first? Well, if you can’t “see” the analytes, what good is perfecting their chromatography? So, first, let’s get the MS focused, or tuned, for optimum analyte detection.
Let’s quickly recap: last time, I discussed how to gather information from the literature that would best suit our application for the detection of naloxone, buprenorphine, norfentanyl, and methadone in urine. We have our matrix and our analytes and a Shimadzu NexeraX2 LC with a 5500 Sciex MS.
We did some searching and eventually settled on a poster we found on the Biotage website titled:
Now what?
If we break down our MS, which is shown in the figure as a triple quadrupole mass spectrometer, what we see are really two main regions of interest: the point of entry of our analytes (the ESI source), and their detection via mass filtering (quad Q0, Q1, Q2, and Q3 or as some call it, the optics). The source essentially removes the liquid (mobile phase) that carries our analytes to the MS from the LC. It uses heat, voltage, and gas to maximize the number of our analytes that can gain entry into the MS while minimizing entry of any interfering contaminants. Once inside the MS, the optics act as an electronic filter and zoom in on our analytes based on their intrinsic molecular properties.
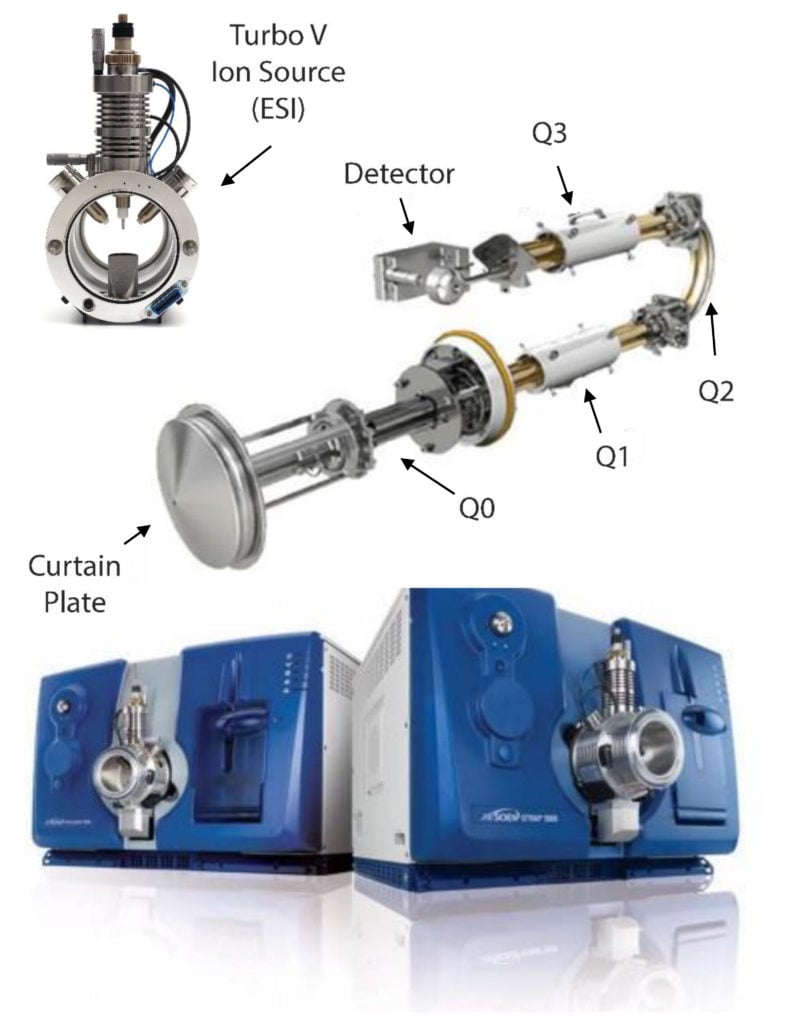
So, let’s discuss the point of entry: the ESI source
We have our extraction parameters maximized to collect as much analyte as possible from our matrix. Now we need to tune the source to maximize the number of our analytes that will enter the mass spectrometer and filtered by Q1. We do this by tuning the source parameters using a technique called Flow Injection Analysis (FIA). This process is very similar to calibrating your Sciex 5500 MS, but instead, mimics a sample injection using the HPLC, but without an LC column. Essentially, the chromatography is removed from the workflow, thus most of the parameters during a sample run are present during analyte analysis. In this way, FIA will help us determine the conditions necessary to transfer the maximum concentration of our analytes from the mobile phase, into the curtain plate, past Q0, and into Q1, and finally the detector – the use of both Q2 and Q3 will be discussed next time.
For our FIA, we make the general assumption that our analytes will likely elute at or around a 50:50 composition of our mobile phase, which for us is water and methanol with 0.1% formic acid at 0.6 mL/min, based on the method in the poster that we found. We set our LC parameters accordingly and prep about 1 mL of a test mix with all of our analytes at 50 ng/mL in our mobile phase composition – we want to make sure we “see” our analytes, yet without saturating the detectors response.
The next step is typically dependent upon the software you are using, but the principle is the same for all LC/MS instruments.
We make a series of injections that measure our analytes response against an increase in a particular parameter until we find the best signal. In other words, the system will inject some of our test-mix with the source temperature set at 300 °C and measure the detectors response for the m/z of each analyte. The detector sets the first quadrupole at the m/z of our analyte(s) and measures the response at that temperature. This is done for each analyte we designate – for the Sciex 5500, you can list up to 20 analytes to be evaluated. Next, the temperature is increased, based on our designation, to 350 °C, and the process is repeated.
For the 5500, we typically look at the following parameters for our source FIA:
- TEM: this is the source temperature and ranges from 100 to 750 ° The temperature desolvates the mobile phase in order to assist in producing more droplets concentrated with your charged analytes.
- CUR: this is the curtain gas supply that ranges from 20 to 50 psi. This is the gas (nitrogen) that moves against the ion spray and emanates from behind the curtain plate. It prevents source contamination by ambient air and solvent droplets but allows our ions to pass via the electric fields and high vacuum.
- IS: ion spray voltage, this parameter ensures our analytes from ions and ranges from 500 to 5500 volts. This voltage helps maintain the stability of the spray, which is necessary for maintaining analyte sensitivity.
- GS1: for the Sciex system, this is the nebulizer ion source gas, and it ranges from 0 to 90 psi of nitrogen. The nebulizer gas assists with droplet formation and helps shear droplets from the stream of liquid within the inlet.
- GS2: this parameter is the heater gas and ranges from 0 to 90 psi. When used together with TEM, the GS2 parameter evaporates the liquid solvent with the spray and assists in nearly condensing our charged analytes. If GS1 helps from droplets, GS2 and TEM help evaporate the mobile phase within the droplets.
- DP: the declustering potential. This parameter is specific for each analyte and is very important for maximizing our analytes entry into the MS optics. This potential ranges from 0 to 300 V in positive ion mode and -300 to 0V for negative ion mode. This potential runs across the orifice, or entry point of the MS, and prevents ions from clustering with adducts (like sodium) or neutral species without causing analyte (or in-source) fragmentation.
Each source parameter is evaluated via FIA for each of the analytes. For the Sciex 5500, we will have to take into consideration each parameter and decide which is best suited for the entire set of analytes. Using FIA, we’ve settled on our global source parameters, and thus, we have determined the voltages, temperatures, and flow characteristics that will successfully bring our analytes into the mass spectrometer and maximize their signal.
While you could have used the parameters in Biotage poster, its best to tune your analytes on your instrument.
Why?
Because you need to tune your analytes against the current condition of your instrument, not some else’s.
Want to know more on how sample prep can continue to keep your LC/MS producing accurate results with high sensitivity - follow the link below!