 Organic Workflow
 Peptide Workflow
 Scale-Up Flash Purification
  Sample Preparation
 Biomolecule Purification
 Oligo synthesis
 Scavengers and Reagents
 Service & Support
 Accessories & Spare parts
 Investors
 Reports & News
 The Share
 Corporate Governance
 Calendar
 Sustainability
 Our Offering
 Our History
 Our Locations
 Leadership
For many of us developing an analytical assay requires numerous experiments in addition to lots of data review, and yet despite the feeling of confidence in our success, how reliable is our assay really? How do we measure reliability of our assay?
Well, there are many ways but here I’ll explain the most common approach using a theoretical analyte called compound X, which, in this case, is readily prescribed for arthritis. And like many drugs, compound X is excreted in large quantities, unmodified, in human urine. So, for arguments sake, let’s say we’ve already defined our LC/MS-MS method and we’ve ironed out an extraction method using SLE+.
Supported Liquid Extraction is one of many sample preparation techniques.
Using our SLE+ method, we were able to extract compound X from 0.2 mL of urine, which was diluted with 0.2 mL in 1% aqueous formic acid, eluted from the SLE+ sorbent using two 0.750 mL aliquots of DCM, dried down and reconstituted in 0.2 mL of our mobile phase that represents our HPLC’s initial conditions: MeOH/H2O [60:40]. I only mention the extraction because there is an important footnote here. Since we started with 0.2 mL of urine, we must reconstitute our extraction in the same volume so we have consistency in our compounds beginning and final concentration. (Otherwise, a lot of other calculations need to be done to figure out our on-column concentration versus our starting analyte concentration.)
Our next step is to determine how efficient our extraction is (% Recovery) and if anything in the urine has co-eluted, which might enhance or suppress our recovery (Matrix Effects). To evaluate these effects, we need to perform a series of experiments, each called Pre-Spike, Post-Spike, and Neat Blank (Figure 1). I should also note that it’s important to run everything at least 3 times. That way we know our results are reproducible and not just a fluke.
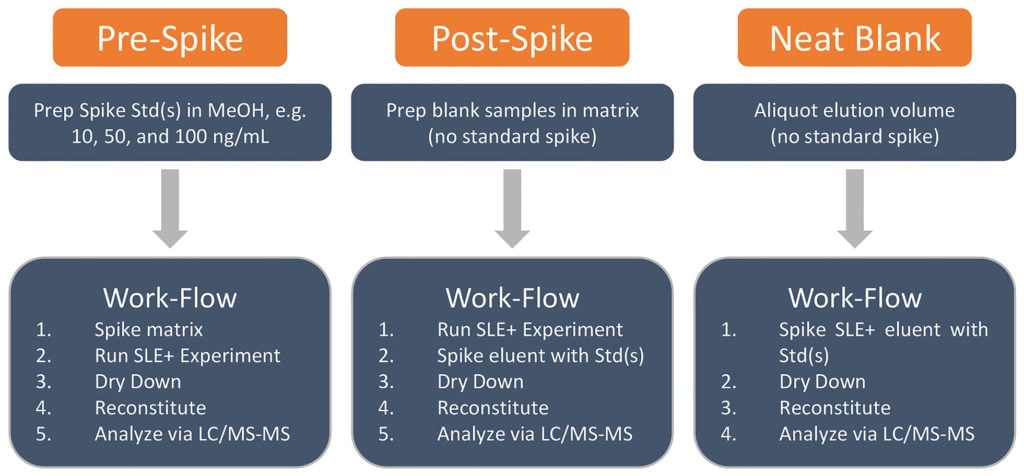
Figure 1. Cursory flow-chart detailing experiments needed to determine percent recovery and matrix effects.
Let start with the pre-spike: this is the sample we processed using our current extraction parameters. The pre-spike represents the amount of compound X we have added into the blank matrix (urine in our case) and extracted using our SLE+ protocol. Typically, we would evaluate three concentrations that lie within the dynamic range of our analyte and/or calibration curve. We want to know how compound X behaves using these extraction conditions, e.g. what if someone were prescribed a high dose of compound X, will our assay accurately report this high concentration? What about low doses? In this case, we’ve selected 10, 50, and 100 ng/mL because this is where we expect to find compound X in our patient samples. So, in urine we would extract each concentration, in triplicate, according to our SLE+ protocol (Figure 1). The integrated peak area for compound X under these three concentrations serves as our pre-spike sample(s) (Table 1).
| Compound X | 10 ng mL/mL (Area) | 50 ng mL/mL (Area) | 100 ng mL/mL (Area) |
| Pre-Spike 1 | 55300 | 263000 | 525000 |
| Pre-Spike 2 | 53000 | 242000 | 515000 |
| Pre-Spike 3 | 53300 | 256000 | 540000 |
| Average (n=3) | 53866 | 253666 | 526666 |
Table 1. Peak area of compound X collected from LC/MS-MS analysis of urine extracted pre-spike samples.
Next, the post-spike: the purpose of this sample is to show what 100% recovery of compound X in urine looks like using our SLE+ extraction parameters. The post-spike is prepared by first extracting blank urine using the same SLE+ method as the pre-spike, but without compound X. After elution, we would spike the eluent with compound X to give a final concentration of 10, 50, and 100 ng/mL. Remember, we are simulating what 100% recovery of compound X using our SLE+ extraction conditions, so the post-spike must be treated in the same way as the pre-spike to make a direct comparison. Once we’ve dried down, reconstituted, and analyzed our post and pre-spikes via LC/MS-MS, we can then calculate how much of compound X we were able to extract by calculating the percent recovery of compound X (Equation. 1).
Equation 1. % Recovery = [(Peak Area of Pre-Spike) / (Average Peak Area of n Post-Spikes, where n ≥ 3)] X 100
| Compound X | 10 ng/mL (Area) | 50 ng/mL (Area) | 100 ng/mL (Area) |
| Post-Spike 1 | 55600 | 253000 | 522000 |
| Post-Spike 2 | 58100 | 269000 | 541000 |
| Post-Spike 3 | 56300 | 266000 | 539000 |
| Average (n=3) | 56700 | 263000 | 534000 |
Table 2. Compound X peak area collected from LC/MS-MS analysis of post-spike urine samples.
Examination of both pre-spike and post-spike helps us determine the percent recovery of our sample using equation 1, which demonstrates the efficiency or robustness of our SLE+ method extracted across our calibration range. Looking at our recoveries we see that our SLE+ method is able to recover the majority of compound X within a range of 10 to 100 ng/mL, not too shabby! (Table 3).
| Compound X | 10 ng/mL | 50 ng/mL | 100 ng/mL |
| Average (n=3) | 95 | 97 | 99 |
Satisfied with the recoveries?
Well, we should be! But how do we know that something in the matrix, or urine, isn’t affecting the recovery? What if something enhances our signal that isn’t captured or eliminated by our extraction procedure? In other words, we need to ask if the matrix plays a role in enhancing or suppressing the signal of compound X.
This brings us to the Neat Blank: this is a sample that represents the baseline recovery of an efficient extraction. This “blank” simulates the complete removal of all potential interference’s that may either enhance or suppress the LC/MS-MS signal of compound X. Essentially, we are asking “what effect does the matrix, in this case urine, have upon compound X”?
For example: using the same spike concentrations used in our pre-spike, we would simply spike 1.5 mL of neat elution solvent (2x, 0.750 mL of DCM) with a low volume (10-30 mL) of our 10, 50, and 100 ng/mL compound X stocks. After spiking, the neat spikes are dried down and reconstituted in 0.2 mL in MeOH/H2O [60:40] for LC/MS-MS analysis (Figure 1).
| Compound X | 10 ng/mL (Area) | 50 ng/mL (Area) | 100 ng/mL (Area) |
| Neat 1 | 57800 | 276000 | 577000 |
| Neat 2 | 59100 | 293000 | 555000 |
| Neat 3 | 58300 | 269000 | 530000 |
| Average (n = 3) | 58400 | 279000 | 554000 |
Table 4. Peak area of compound X collected from LC/MS-MS analysis of neat blanks.
Matrix effects are, as previously stated, used to identify any suppression or enhancement of compound X in your 0.2 mL of urine. This effect is determined by the quotient of the post-spike to neat blank as shown in equation 2 (Table 5).
Equation 2. Matrix Effect = [1-(Peak Area of Post-Spike)/(Average Peak Area of n Neat Blanks, where n ≥ 3)] x 100
| Compound X | 10 ng/mL | 50 ng/mL | 100 ng/mL |
| Average (n=3) | 3 | 6 | 3.6 |
So how do we interpret the numbers behind the matrix effects?
In this case, we see that our conditions may allow for matrix effects of 3-6%. The relationship between the values and physical effects relate to their magnitude and direction (positive/negative) of the value, i.e. the more positive the value, the larger the suppression, the more negative the value, the larger the enhancement. Since we have a suppressive effect with compound X, a very small one, we could examine alternative elution solvents that might yield a cleaner extract. Since dichloromethane possesses a moderately high dielectric constant, when compared to water, perhaps using a solvent with a lower polarity wouldn’t solubilize the matrix components responsible for suppression? Regardless, there are many avenues to examine when considering the reduction of matrix effects and increasing recovery, all of which are determined empirically. We can go over that another time!
Need to know more about matrix effects? Watch our latest webinar "One Size Does Not Fit All: Considerations for Minimizing Matrix Effects and Maximizing Recovery for Clinical Panels Large and Small".